08. The graph view
Read a MeTTa expression as connected nodes. The head and ordered children reconstruct the source term. In the factorial equation below, the equation, comparison, multiplication, subtraction, recursive call, and variables remain visible as one graph.
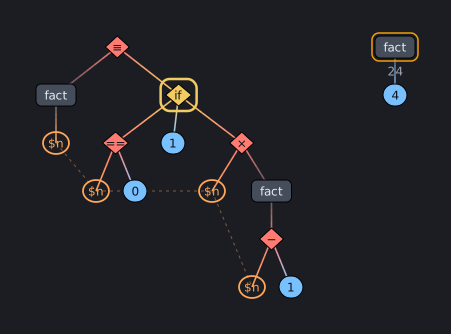
Pettagrapher uses shape and color for syntax roles. Symbols use neutral nodes. Variables use hollow orange nodes. Numbers and strings use blue variants. Operators and control forms use diamond nodes. Repeated variables receive a faint connecting line because they share one binding name.
The selected (fact 4) root has the label 24. A label describes the result associated with that exact term; it does not change the atom or execute it. The highlighted if is also a visual directive, not a MeTTa type declaration.
Pettagrapher accepts real MeTTa atoms. Call pettagrapher.graph_svg for a raw SVG or graph_page for a self-contained HTML page. term_svg uses nested blocks instead of connected nodes. space_page lists stored atoms, derivation_page draws proof trees, and reduction_page turns m.trace events into an animated HTML page.
Watch a reduction run
reduction_page needs a traced program. The frame below comes from the factorial function traced through !(fact 3): eight trace events become animation steps, each step morphs the terms of one rewrite into the next, and the last step lands on the answer 6. It starts playing on load, and the Prev, Play, and Next buttons step it by hand.
Open the animation in its own tab.
The SVGs and the animation page in these tutorials were generated ahead of the site build. The committed files under public/visuals are ordinary static assets, so reading the site does not require a pettagrapher checkout or a running engine.
You now have the path from atoms through spaces, rewrites, Python boundaries, definitions, types, diagnostics, and graph views. Continue with the Guide for deeper runtime features or open the API reference for exact signatures and docstrings.